You can add the function omni_theme() to the end of any
ggplot2 pipeline and it will generate plots that look like the same. The
theme uses minimalist gridlines and the Lato font throughout.
iris %>%
  group_by(Species) %>%
  summarise(sepal_length_mean = mean(Sepal.Length)) %>%
  ggplot(ggplot2::aes(x = Species, y = sepal_length_mean, fill = Species)) +
  geom_bar(stat = "identity") +
  coord_flip() +
  scale_fill_omni_discrete() +
  theme_omni()
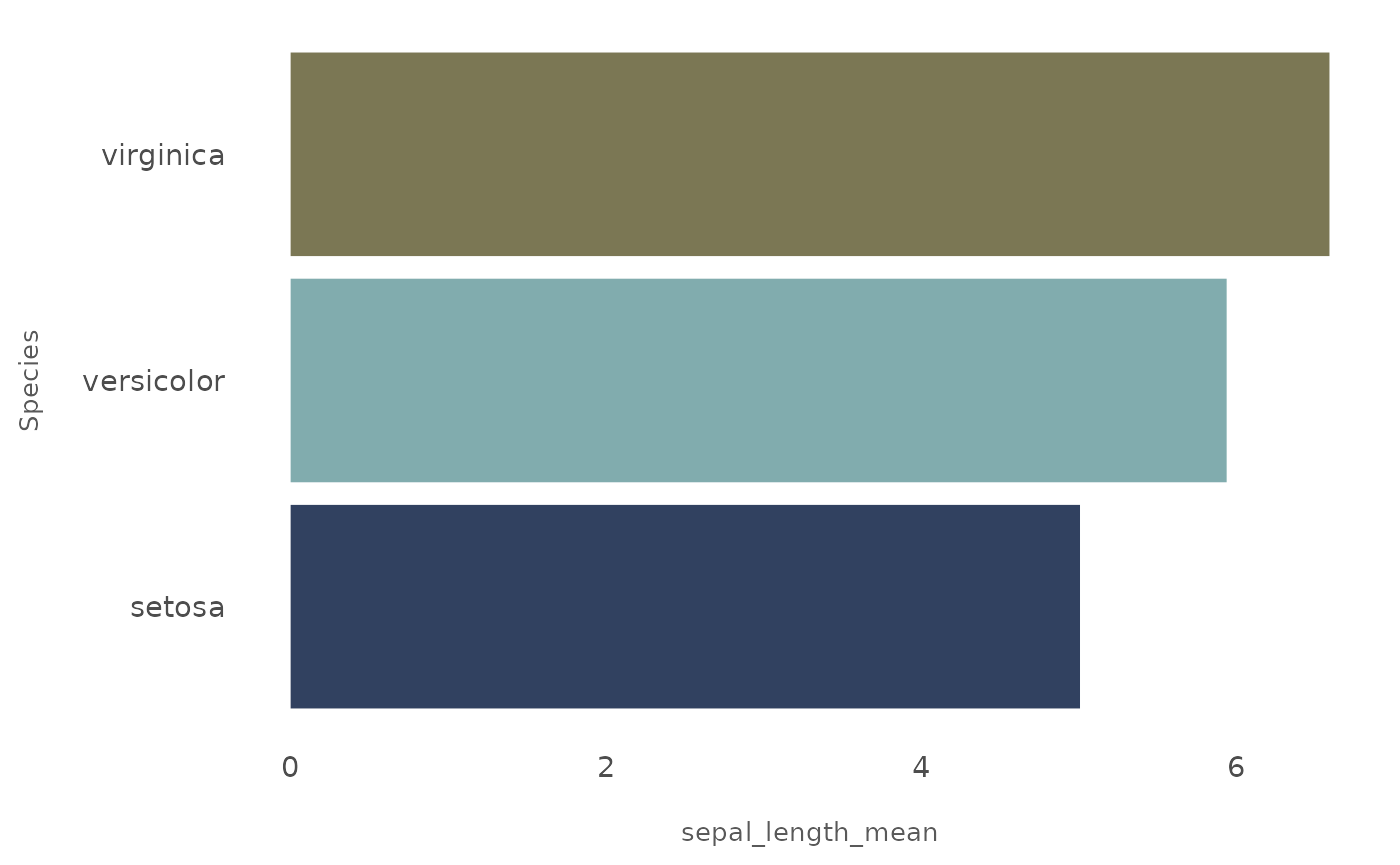
The theme_omni() function has two arguments.
show_grid_lines (set to TRUE by default) determines whether
or not grid lines show up. Here’s a plot with no grid lines.
iris %>%
  group_by(Species) %>%
  summarise(sepal_length_mean = mean(Sepal.Length)) %>%
  ggplot(ggplot2::aes(x = Species, y = sepal_length_mean, fill = Species)) +
  geom_bar(stat = "identity") +
  coord_flip() +
  scale_fill_omni_discrete() +
  theme_omni(show_grid_lines = FALSE)
The second argument is show_legend (set to TRUE by
default). Here’s a plot with the legend removed.
iris %>%
  group_by(Species) %>%
  summarise(sepal_length_mean = mean(Sepal.Length)) %>%
  ggplot(ggplot2::aes(x = Species, y = sepal_length_mean, fill = Species)) +
  geom_bar(stat = "identity") +
  coord_flip() +
  scale_fill_omni_discrete() +
  theme_omni(show_legend = FALSE)