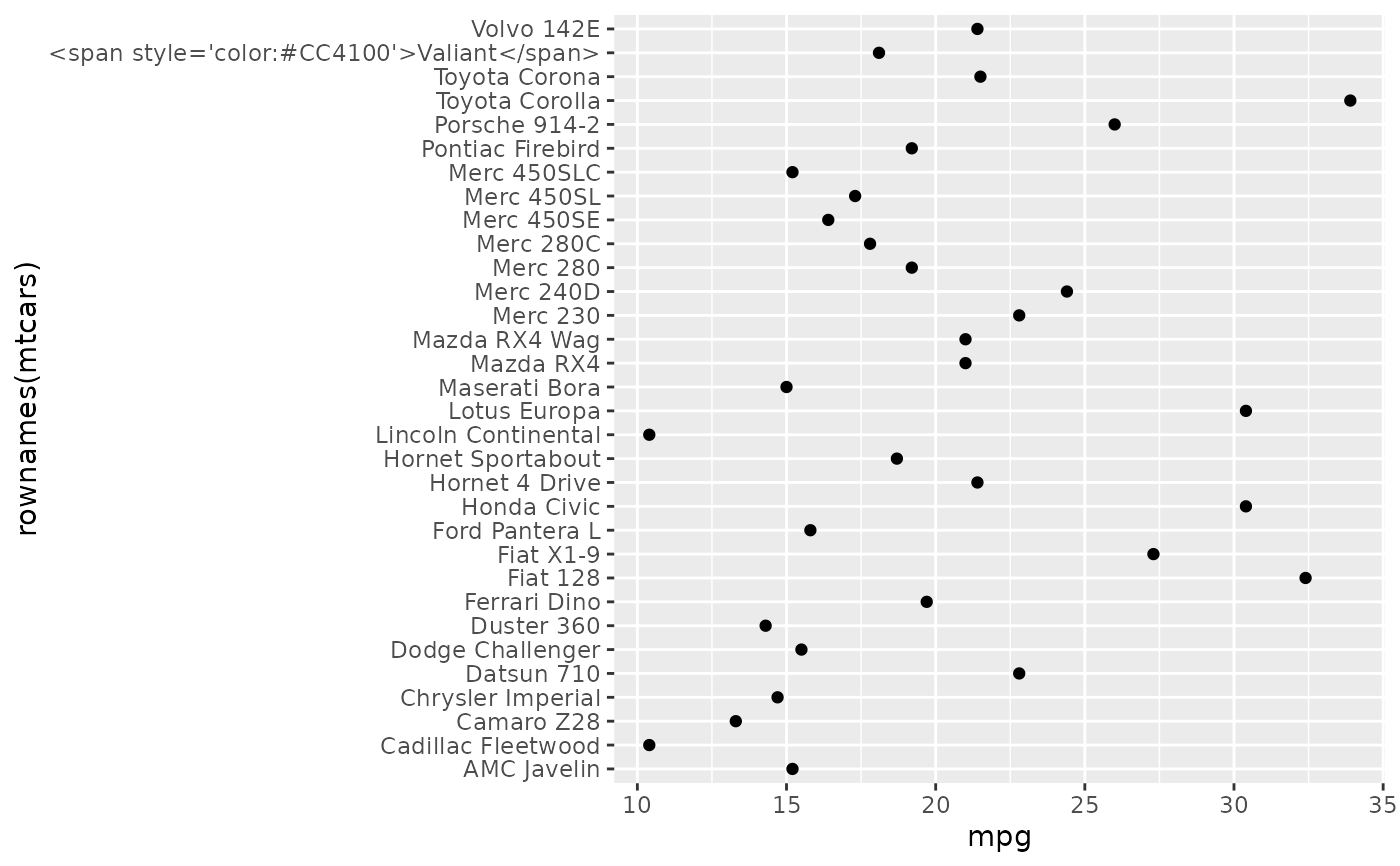
Returns a labelling function (for `scale_*_discrete(labels = ...)`) that wraps any label in `highlight` in a colored span. Requires the categorical axis text to render as markdown in the chart gray, e.g. `theme(axis.text.y.left = ggtext::element_markdown(colour = omni_colors("chart-gray")))`.
Details
`color` is required, deliberately. A chart uses one highlight color, and the colored axis label has to be that same color - it is labelling the bar or point it sits next to. A default here would silently produce a label in one color and a bar in another whenever the chart's highlight isn't the default, which is a brand violation nothing in the rendered output flags. Pass the same color given to [omni_header()].
Examples
library(ggplot2)
ggplot(mtcars, aes(mpg, rownames(mtcars))) +
  geom_point() +
  scale_y_discrete(
    labels = omni_highlight_labels("Valiant", color = "orange-red-600")
  )