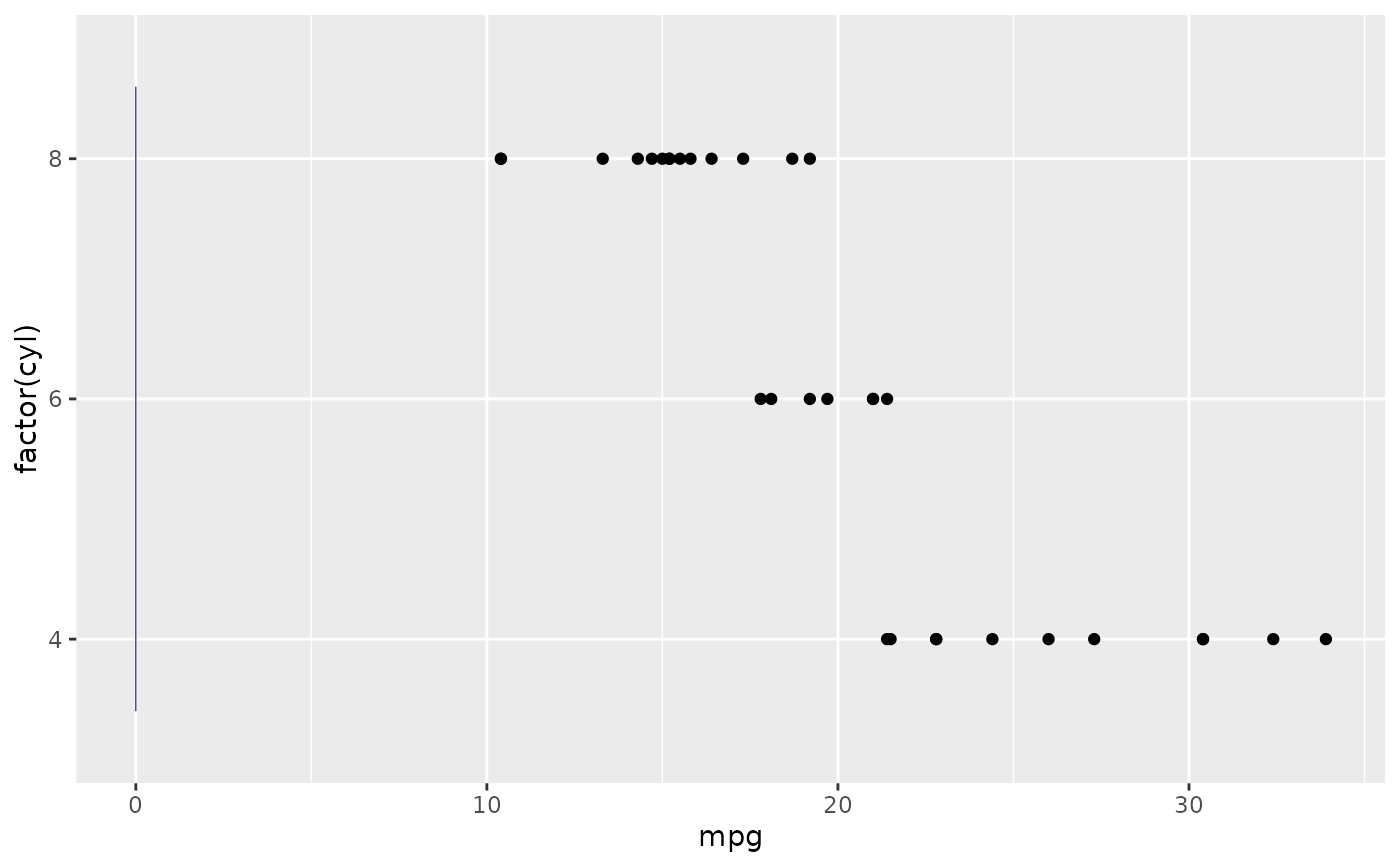
Draws the light navy baseline next to the category labels, spanning only the data rows
(not the full panel height). Omit on bar/column charts, where the bars already begin at
the labels.
Usage
omni_baseline(n, orientation = c("vertical", "horizontal"), at = 0, pad = 0.3)
Arguments
- n
Number of categories on the categorical axis.
- orientation
`"vertical"` line (horizontal charts) or `"horizontal"` (vertical charts).
- at
Baseline position on the value axis (usually 0).
- pad
Extension beyond the first/last category center.
Value
A single `annotate("segment", ...)` layer.