class: center, middle, inverse, title-slide # Advanced RMarkdown ## Going Deeper with R --- layout: true <div class="dk-footer"> <span> <a href="https://rfortherestofus.com/" target="_blank">R for the Rest of Us </a> </span> </div> --- class: center, middle, inverse, dk-section-title background-image:url("images/text.jpg") # Advanced Markdown Text Formatting --- ## Links This is a [link to the Rest for the Rest of Us website](http://rfortherestofus.com/) --  --- ## Images  -- <br>  --- ## Block quotes > Four score and seven years ago our fathers brought forth on this continent, a new nation, conceived in Liberty, and dedicated to the proposition that all men are created equal. -- <br>  --- ## Footnotes ^[This is a footnote] --- class: center, middle ## `remedy` <img src="images/remedy-logo.png" width="300px" /> .button[ [Learn more about remedy](https://thinkr-open.github.io/remedy/) ] --- class: my-turn ## My Turn Working in my RMarkdown report created in the data visualization section, I'll do the following: 1. Add a link 1. Add an image 1. Add a block quote 1. Add a footnote --- class: inverse ## Your Turn - Add the Oregon Department of Education logo to the top of your report. You can find it at https://github.com/rfortherestofus/going-deeper/raw/master/slides/images/ode-logo.jpg - Add the following text (make sure you include the link, which points to https://www.oregon.gov/ode/pages/default.aspx): This is a report for the [Oregon Department of Education](https://www.oregon.gov/ode/pages/default.aspx) on diversity in Oregon school districts. --- class: inverse ## Your Turn (continued) - Add the following text as a block quote: > The Oregon Department of Education fosters equity and excellence for every learner through collaboration with educators, partners, and communities. - Add a link to the source for mission statement above (https://www.oregon.gov/ode/about-us/Pages/default.aspx) as a footnote. --- class: center, middle, dk-section-title background-image:url("images/table.jpg") # Tables --- ## Don't Use the Default .center[ 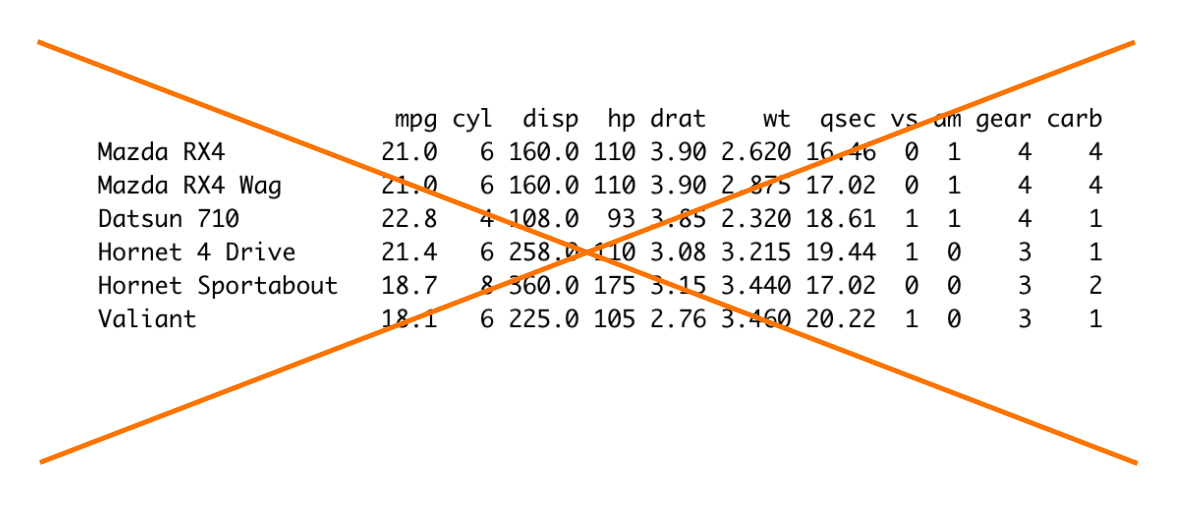 ] --- ## Data Frame Printing ```r --- title: "Snazzy Report" output: html_document: * df_print: tibble --- ``` 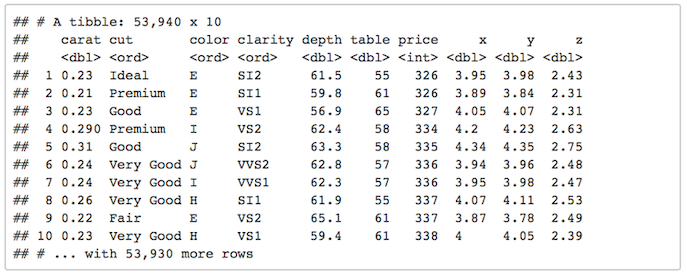 --- ## Data Frame Printing ```r --- title: "Snazzy Report" output: html_document: * df_print: kable --- ``` -- 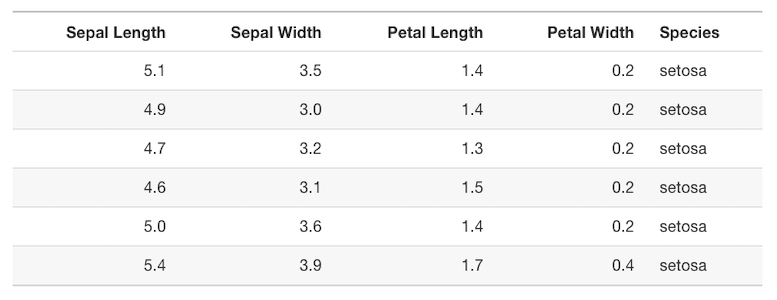 --- ## Data Frame Printing ```r --- title: "Snazzy Report" output: html_document: * df_print: paged --- ``` -- 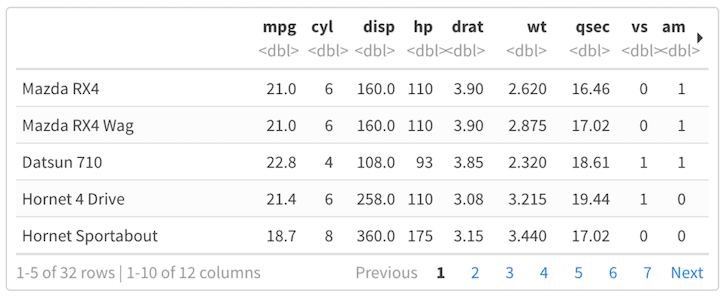 --- class: center, middle, dk-section-title background-image:url("images/packages.jpg") ## Table Packages --- ### gt .center[  .button[ [Learn more about gt](https://gt.rstudio.com/) ] ] --- ### kable + kableExtra .center[  .small[ Source: [Sharla Gelfand](https://twitter.com/sharlagelfand/status/1192674485792641024) ] .button[ [Learn more about kableExtra](https://cran.r-project.org/web/packages/kableExtra/vignettes/awesome_table_in_html.html) ] ] --- ### formattable .center[  .button[ [Learn more about formattable](https://renkun-ken.github.io/formattable/) ] ] --- ### DT .center[  .button[ [Learn more about DT](https://rstudio.github.io/DT/) ] ] --- ### reactable .center[  .button[ [Learn more about reactable](https://glin.github.io/reactable/index.html) ] ] --- ### flextable .center[ <img src="images/flextable.svg" width="60%" /> .button[ [Learn more about flextable](https://davidgohel.github.io/flextable/) ] ] --- class: my-turn ## My Turn I'll demonstrate making an effective table using `gt` ??? - Title - Set Names (cols_label) - Align - Width - Formatting numbers - Color shading - Source --- class: inverse ## Your Turn Do the following: 1. Change the default data frame printing method to use kable 1. Choose one of the table packages and make an attractive table that shows the top 10 districts with the highest percentage of Hispanic/Latino students (hint: use the `slice_max()` function to get the top 10 and the `fmt_percent()` function if you're using `gt` or the `percent()` function otherwise to display the percentage of Hispanic/Latino students in each) --- class: center, middle, dk-section-title background-image:url("images/book.jpg") # Advanced YAML --- ## Table of Contents ```r --- title: "Snazzy Report" output: html_document: * toc: TRUE toc_depth: 2 toc_float: TRUE --- ``` --- ## Table of Contents ```r --- title: "Snazzy Report" output: html_document: toc: TRUE * toc_depth: 2 toc_float: TRUE --- ``` --- ## Table of Contents ```r --- title: "Snazzy Report" output: html_document: toc: TRUE toc_depth: 2 * toc_float: TRUE --- ``` --  --- ## Figure Options ```r --- title: "Snazzy Report" output: html_document: * fig_width: 7 fig_height: 6 fig_caption: TRUE --- ``` --- ## Figure Options ```r --- title: "Snazzy Report" output: html_document: fig_width: 7 * fig_height: 6 fig_caption: TRUE --- ``` --- ## Figure Options ```r --- title: "Snazzy Report" output: html_document: fig_width: 7 fig_height: 6 * fig_caption: TRUE --- ``` ??? You can also do this in the setup chunk and/or in individual code chunks https://twitter.com/xieyihui/status/1232762844980137984 --- ## Parameters ```r --- title: "Snazzy Report" output: html_document params: * state: "California" --- ``` --- ## Parameters 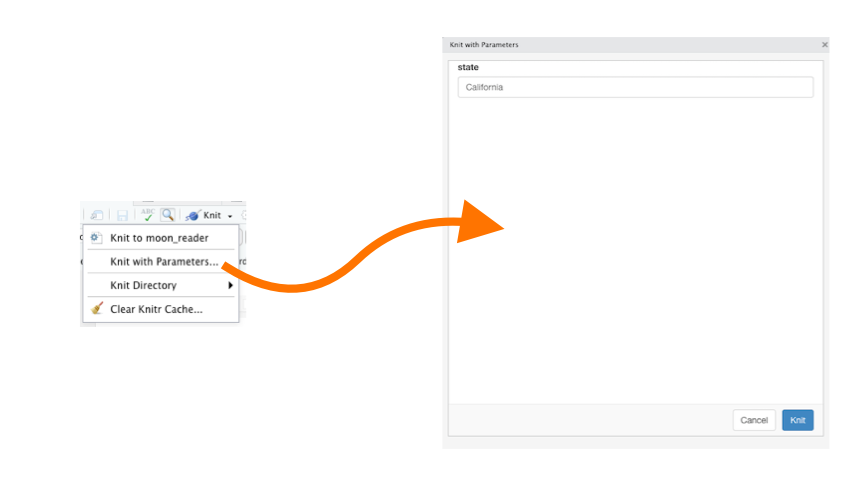 ??? Learn More https://medium.com/@urban_institute/iterated-fact-sheets-with-r-markdown-d685eb4eafce --- class: center, middle ## Additional Options .pull-left[ [](https://bookdown.org/yihui/rmarkdown/html-document.html) ] -- .pull-right[ [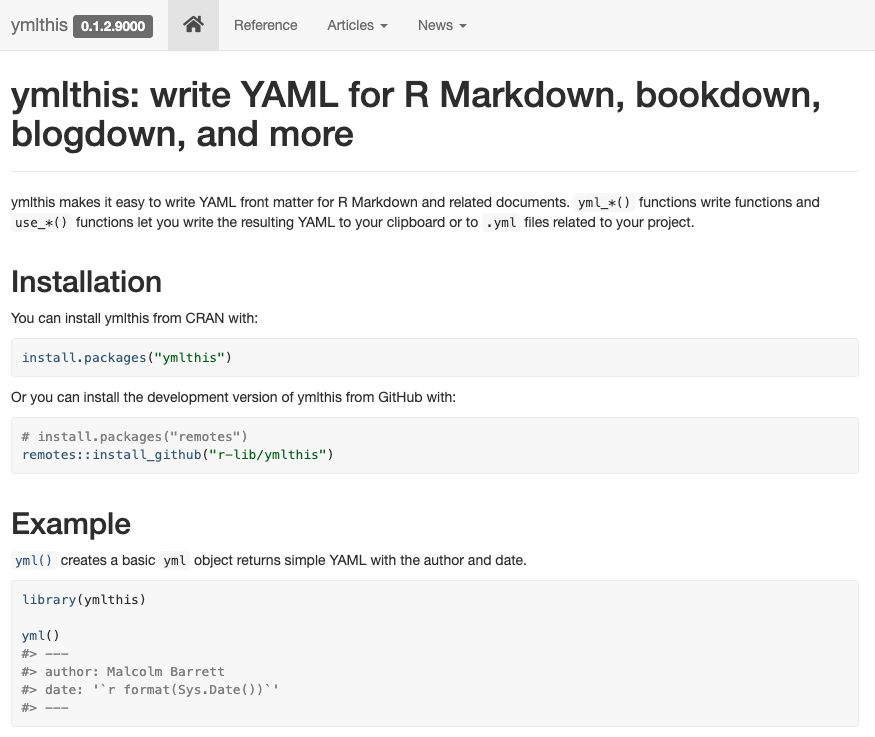](https://ymlthis.r-lib.org/) ] ??? TK: Here is where to talk about how you can do this as code chunk options as well I think --- class: my-turn ## My Turn I'll do the following: 1. Add a table of contents 1. Adjust default figure height, width, and captions 1. Add a parameter to the YAML and use it in the body of my report 1. Knit to make sure everything works --- class: inverse ## Your Turn -- 1. Add a table of contents and make it floating -- 1. Adjust default figure height, width, and captions -- 1. Add a parameter to the YAML and use it in the body of your report to dynamically create a table of the top 10 districts by various race/ethnicity categories. --- class: center, middle, dk-section-title background-image:url("images/inline-skating.jpg") # Inline R Code --- ## Inline R code These two bits of text look identical, right? -- In 2019, there were 854 German speakers in California. -- In 2019, there were 854 German speakers in California. --- ## Inline R code They're not identical! -- In 2019, there were 854 German speakers in California. --  --- ## Inline R code  --- class: my-turn ## My Turn I'll add a line to my report that uses inline R code --- class: inverse ## Your Turn Add a line to your report that uses inline R code --- class: center, middle, dk-section-title background-image:url("images/microsoft-word.jpg") # Making Your Reports Shine: Word Edition --- ## Making Your Reports Shine: Word Edition -- ```r --- title: "Snazzy Report" output: word_document: reference_docx: my-word-template.docx --- ``` -- <img src="images/docx-not-dotx.svg" width="60%" /> ??? https://templates.office.com/en-us/team-report-tm00002118 --- class: my-turn ## My Turn I'll do the following: 1. Use a reference document to change the look and feel of my reports that are knitted to Word --- class: inverse ## Your Turn Use a reference document to change the look and feel of your report when knitted to Word --- ## Making Your Reports Shine: HTML Edition 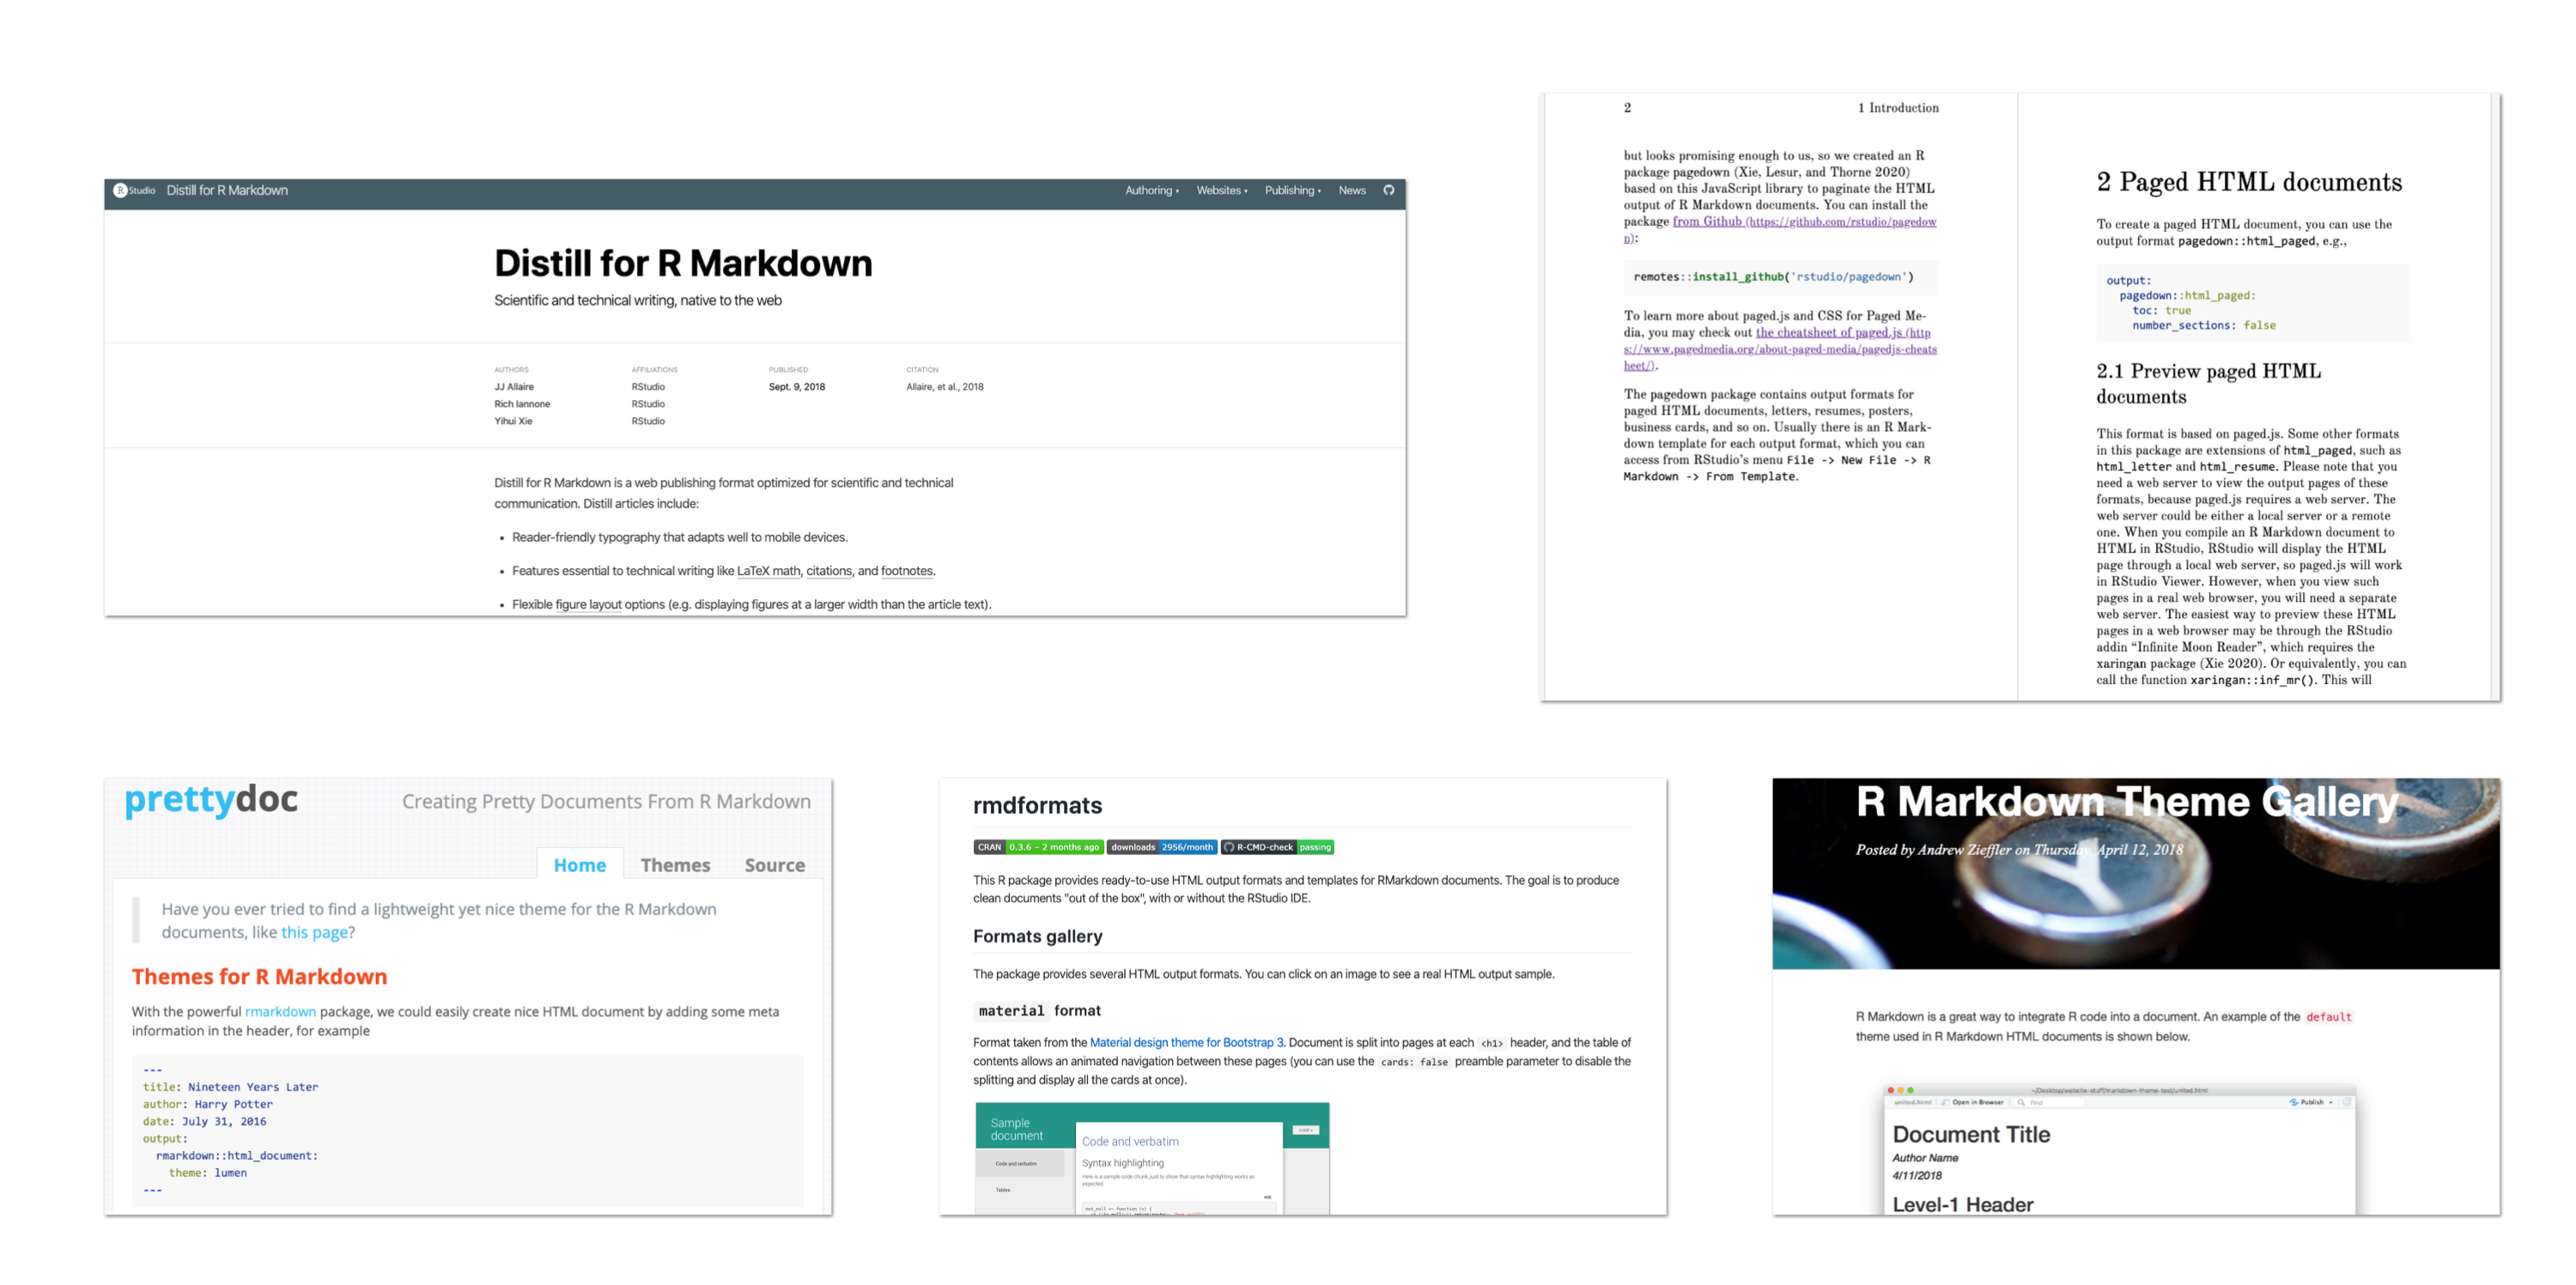 ??? - https://rstudio.github.io/distill/ - https://github.com/hrbrmstr/markdowntemplates - https://prettydoc.statr.me/themes.html - https://github.com/juba/rmdformats - https://www.datadreaming.org/post/r-markdown-theme-gallery/ - https://pagedown.rbind.io/ If you want to really customize, you need to learn CSS - https://www.freecodecamp.org/learn/responsive-web-design/basic-css/ --- class: my-turn ## My Turn I'll convert my report to distill format --- class: inverse ## Your Turn Change the theme of your report by adding a theme option to your YAML. Use any of the following options: “cerulean”, “cosmo”, “flatly”, “journal”, “lumen”, “paper”, “readable”, “sandstone”, “simplex”, “spacelab”, “united”, and “yeti” --- ## Making Your Reports Shine: PDF Edition -- .center[ [](https://sctyner.github.io/static/presentations/Conferences/dcr19/slides.html#12) ] --- ## Making Your Reports Shine: PDF Edition .center[ [](https://twitter.com/jefflittlejohn/status/1216869830726316033) ] --- ## Making Your Reports Shine: PDF Edition .center[ [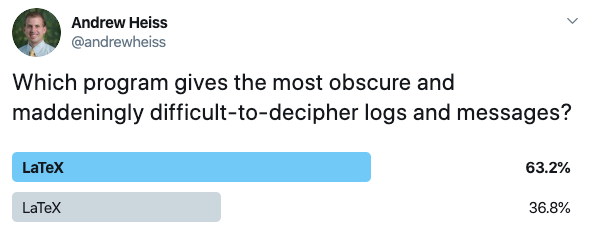](https://twitter.com/andrewheiss/status/1204870408148832257) ] --- ## Making Your Reports Shine: PDF Edition .center[ [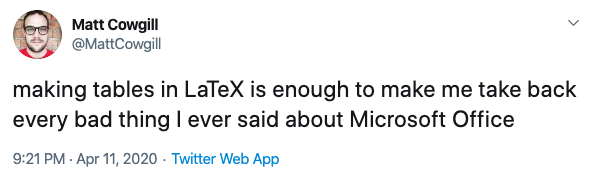](https://twitter.com/MattCowgill/status/1249190934392307712) ] --- ## Making Your Reports Shine: PDF Edition .center[ [](https://twitter.com/thattommyhall/status/1248679614337241089) ] --- ## Making Your Reports Shine: PDF Edition --  --- ## Making Your Reports Shine: PDF Edition ```r --- title: "Snazzy Report" output: pagedown::html_paged: toc: TRUE number_sections: FALSE --- ``` --- ## Making Your Reports Shine: PDF Edition ```r --- title: "Snazzy Report" *knit: pagedown::chrome_print output: pagedown::html_paged: toc: TRUE number_sections: FALSE --- ``` --- ## Making Your Reports Shine: PDF Edition Use the `chrome_print()` function from `pagedown` to turn any HTML document into a PDF. ```r library(pagedown) chrome_print("slides.html") ``` --- class: my-turn ## My Turn I'll convert my report to `pagedown` --- class: inverse ## Your Turn Convert your report to `pagedown` --- class: center, middle, dk-section-title background-image:url("images/projector.jpg") # Presentations --- ## Presentations: Powerpoint  ??? https://bookdown.org/yihui/rmarkdown/powerpoint-presentation.html --- ## Presentations: `xaringan` .center[  ] --- class: my-turn ## My Turn I'll convert my report to `xaringan` --- class: inverse ## Your Turn Convert your report to PowerPoint or xaringan and knit it to slides. You'll need to make some adjustments to your formatting to make it work (e.g. adding --- for new slides). --- class: center, middle, dk-section-title background-image:url("images/flexdashboard.png") # Dashboards --- ## Dashboards [](https://rmarkdown.rstudio.com/flexdashboard/examples.html) --- class: my-turn ## My Turn I'll convert my report to a dashboard --- class: inverse ## Your Turn Convert your report to a dashboard --- class: center, middle, dk-section-title background-image:url("images/other-formats.jpg") # Other Formats --- ## bookdown [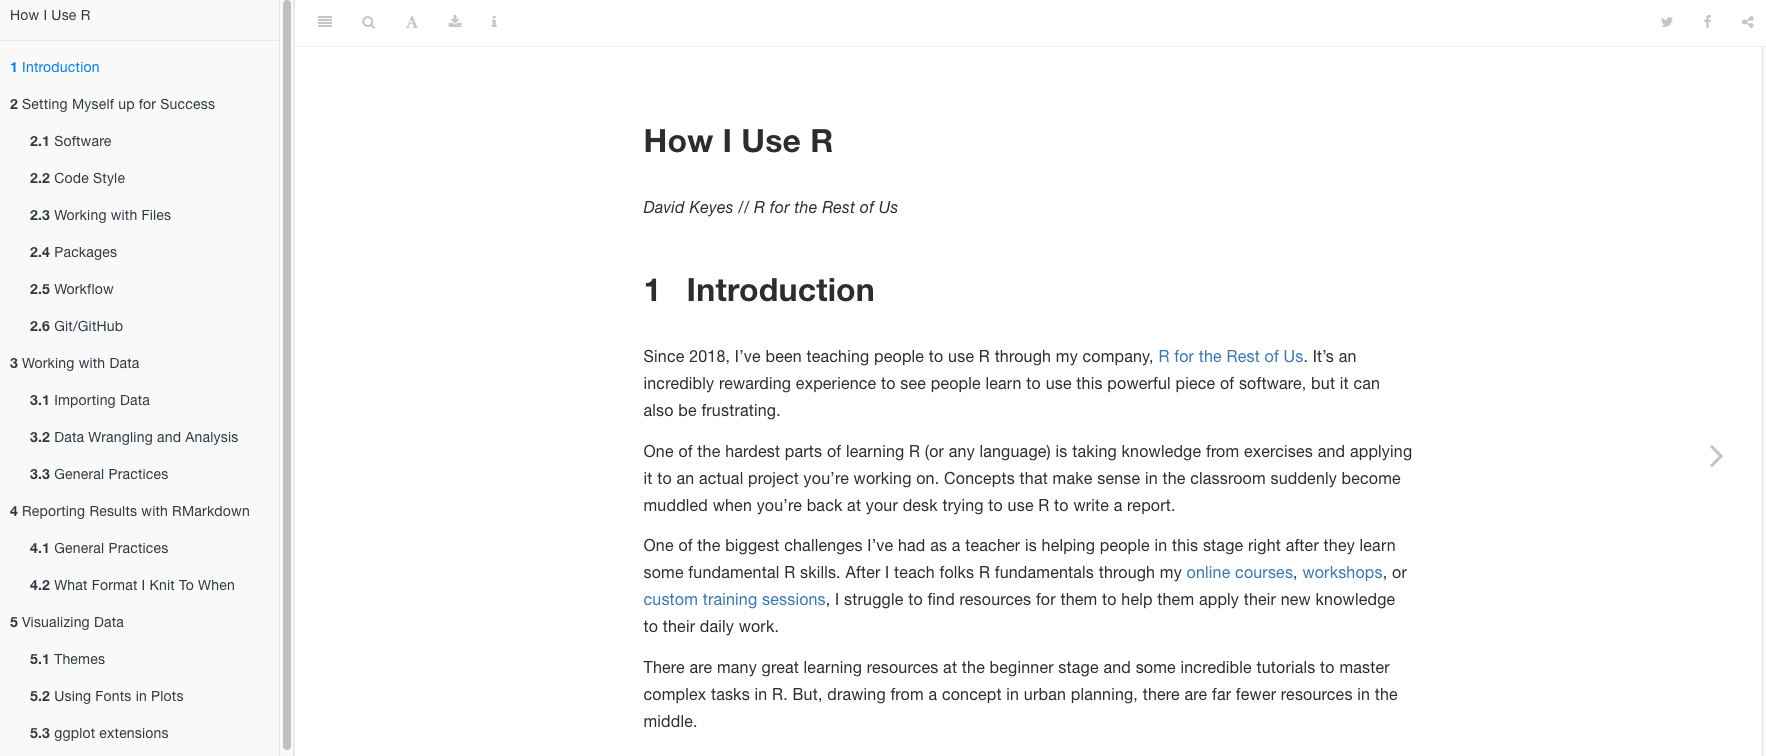](https://howiuser.com/) --- ## Websites [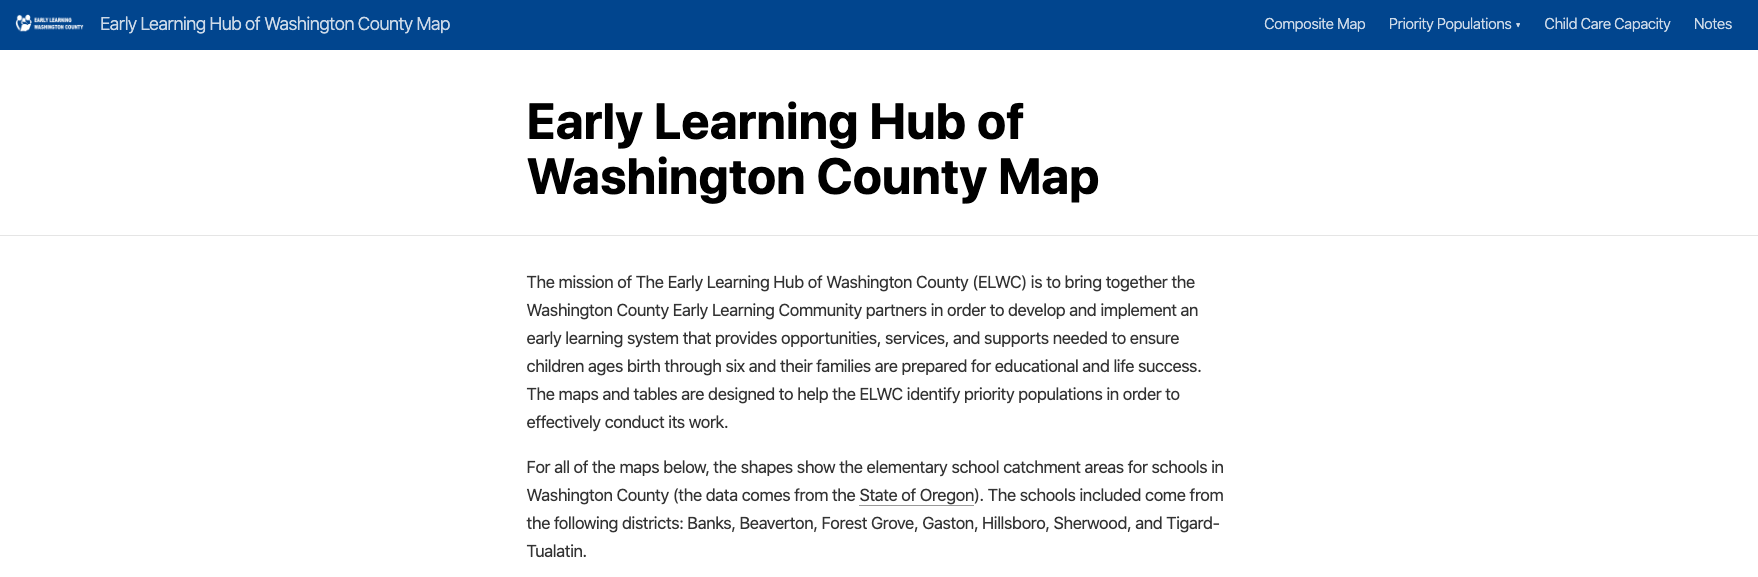](https://dgkeyes.github.io/elwc-map/) --- ## Websites [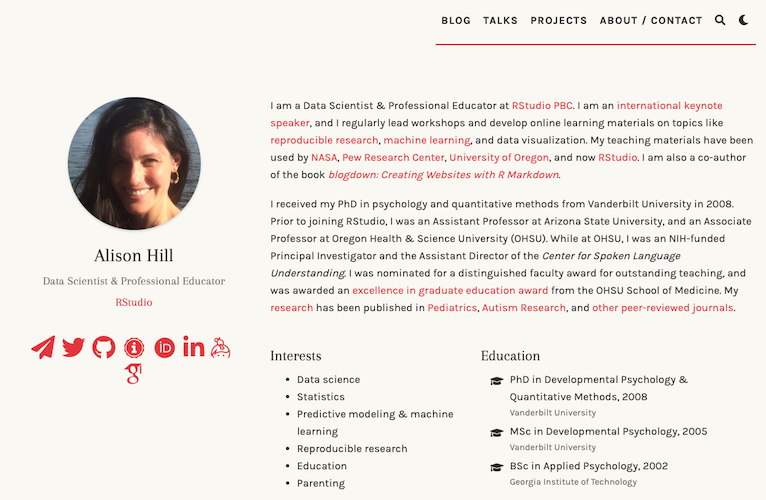](https://alison.rbind.io/) ??? Also show https://tinystats.github.io/teacups-giraffes-and-statistics/index.html --- class: my-turn ## My Turn I'll convert my report to `bookdown` --- class: inverse ## Your Turn Convert your report to `bookdown`